BugSnag Beginners Series – Search and Segment
Knowing that the data you need exists but being unable to find it has got to be one of the most frustrating feelings. The option to search and find exactly what we’re looking for, especially when you’re trying to fix errors in a timely manner, is functionality that we often take for granted. In part four of the Bugsnag Beginners Series, we explain how you can meaningfully extract and section error data with bookmarks by using the Search Builder in the Error Inbox. The advantages of such Search and Segmentation features include:
- Rapid identification of specific errors in your application that you can search based on various criteria, such as the error message, severity level, and affected users
- Organized grouping and filtering of your error data based on factors such as user location, device type, and operating system
To get started, you can sign up for a free trial of BugSnag (no credit card required). Once you’re in, follow the steps below to fully maximize your usage.
How to Search for Errors in BugSnag
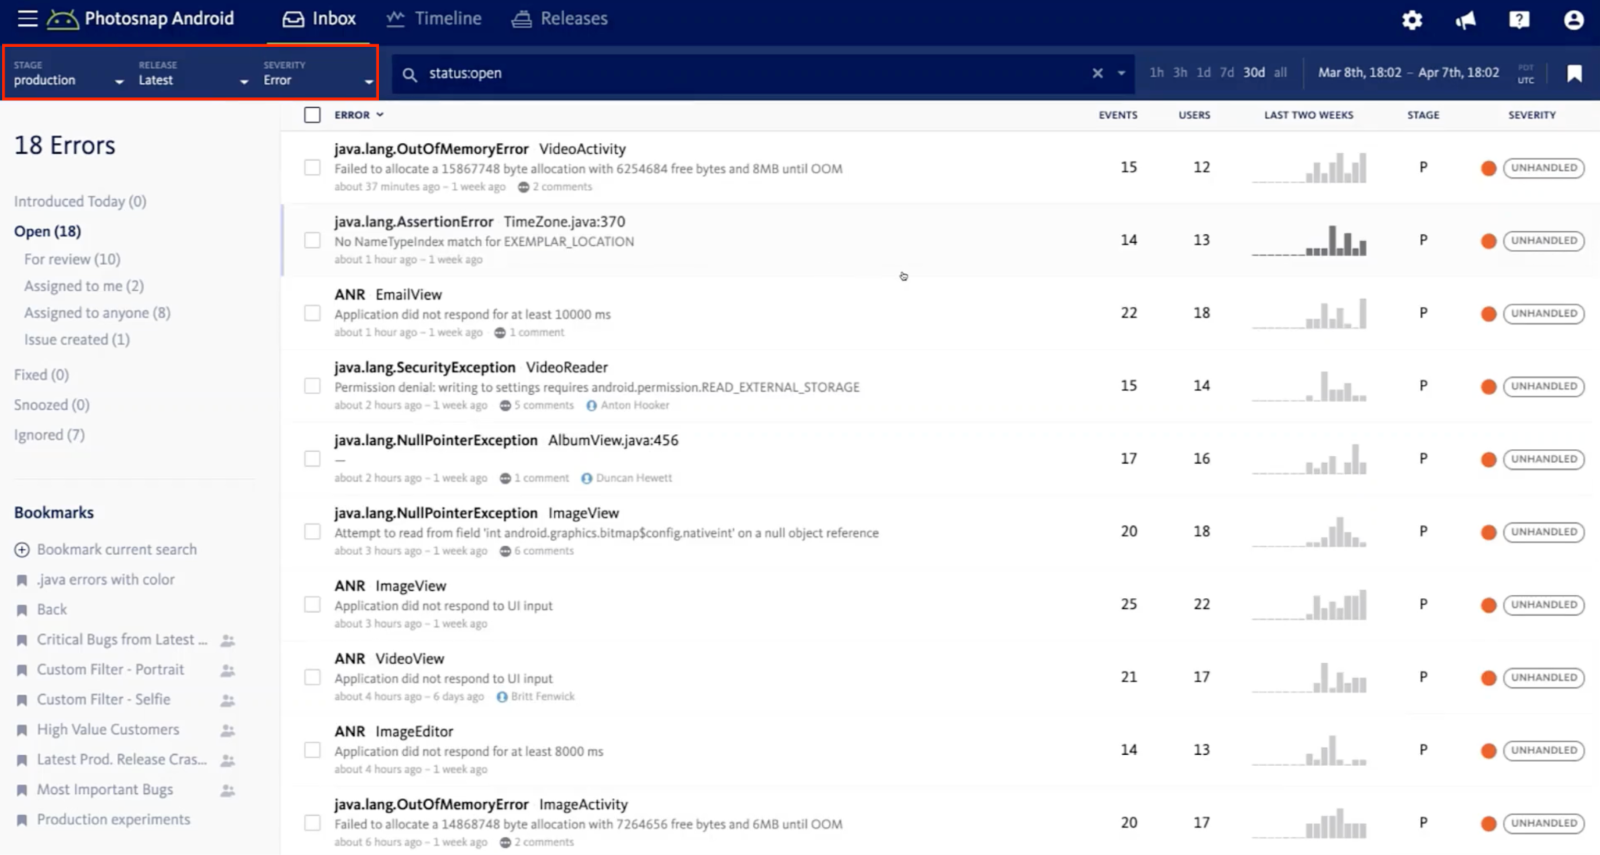
To begin searching for errors, make sure you’re in the Error Inbox of your BugSnag dashboard. To the left of the search bar, you’ll find filters across three categories: stage (i.e., production, staging, and development), release, and severity (i.e., error, warning, and info). For more details on what each of these filters mean, you can refer to the docs.

BugSnag supports partial matches against the error class, error message, filename, and method. Based on your selection, and whenever you update the terms in the search bar at the very top, the inbox will automatically apply the filters and present the corresponding results among your stacktraces. A list of all the matching errors along with more granular information will appear.
What is more, you can use the Search Builder for even more precise querying on top of the code-level details.

Selecting the Search Builder option lets you factor in the following:
- Workflow status (status, linked issues, etc.)
- User (user ID, email, and name)
- Note: If user privacy raises any concern, you can create an anonymized user ID to send to BugSnag and meanwhile keep user records separate from the platform, or you could utilize the self-host adoption feature of BugSnag
- Environment (context, OS version, device manufacturer, and device model)
- With frontend projects, you also can search for browser name and version
- With backend projects, you also can search for hosting and related elements
- Custom filters (locale, login button color, orientation, etc.) by which you can attach custom metadata to your error reports in order to search results specific to your organization
- Example: You can locate and rank errors in VIP accounts according to a custom filter if your business maintains numerous subscription levels; you also can leverage custom filters to conduct engineering experiments as well as A/B tests
For a deeper dive into how each of these fields is defined, make sure to look at the docs.
As commonplace as search may seem to be, it sure is a powerful feature, especially when elevated with advanced functionality.
How to Segment Your Errors in BugSnag
After you identify what you’re searching for, you may want to organize those results for future reference. Once you create an error segment, you can save your search criteria by bookmarking the segment (which you can learn more about on the blog):


You can either keep the bookmark private or share access with other collaborators on your project. BugSnag stores your bookmarks on the bottom left side of your Errors Inbox as shown below:

Any shared bookmarks will contain a multiuser icon:

Hovering over the icon will show you who not only made but also last edited the bookmark – pretty neat.
Further Reading
Search and segmentation can make a huge difference when you’re trying to move fast and focus more of your energy on fixing the problem rather than finding it. To learn more, we encourage you to check out the other posts in this series:
- Part one: Error Inbox
- Part two: Error Details
- Part three: Releases and Stability Center
- Part four: Search and Segment
- Part five: Alerting and Workflow Engine (read next)
