
Navigating BugSnag Performance is Even Easier with Saved Filtersets
Nothing is worse than a clunky UI that stalls productivity. Built for developers by developers, BugSnag prioritizes ease of use. That’s why we’ve implemented some quality-of-life updates to our navigation – read on to learn more.
Search & Segmentation
One aspect of BugSnag that our users love is the ability to search and segment errors by various criteria. Juan, a senior product manager at Mercado Libre, says he appreciates the search and filtering capabilities. “Some cases, you need to go deeper in filtering in order to understand where an issue belongs,” he said. “BugSnag is useful when you need to dig in and see where an error comes from in order to replicate the bug.”
Our search and segmentation function has the following elements:
- Release Stage Filter: Show errors from the release stages you care about, such as production.
- Release/Version Filter: Show errors affecting the important versions of your application.
- Severity Filter: Show only the most serious errors that crash your application.
- Search Box: Simple and powerful search to target specific errors, such as those occurring in a part of your code, affecting certain users, or anything else.
- Date and Time Filter: Errors that occurred recently or within specific date ranges.
Now, you can create saved filtersets that you can access again at any time.
Using Saved Filtersets to Quickly Navigate & Compare
Until recently, users accessed saved views using bookmarks. Bookmarks were renamed as saved filtersets to more accurately represent their use, and the functionality has been expanded to include the BugSnag performance dashboard.
BugSnag performance users can now save filtersets in the same way that filtersets are saved in the error Inbox and timeline dashboards.
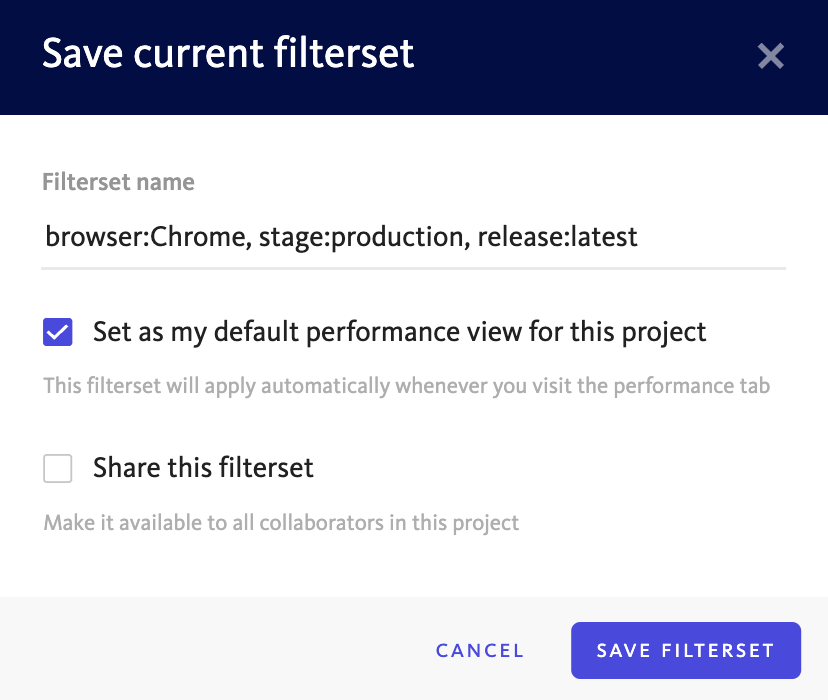
Once you have selected a set of filters and search criteria, together known as a filterset, you can easily save the state of the search bar so you can access it again.
When you save a filterset, you can choose a name for the filterset, make it your default for the project, and share it with your team if desired.
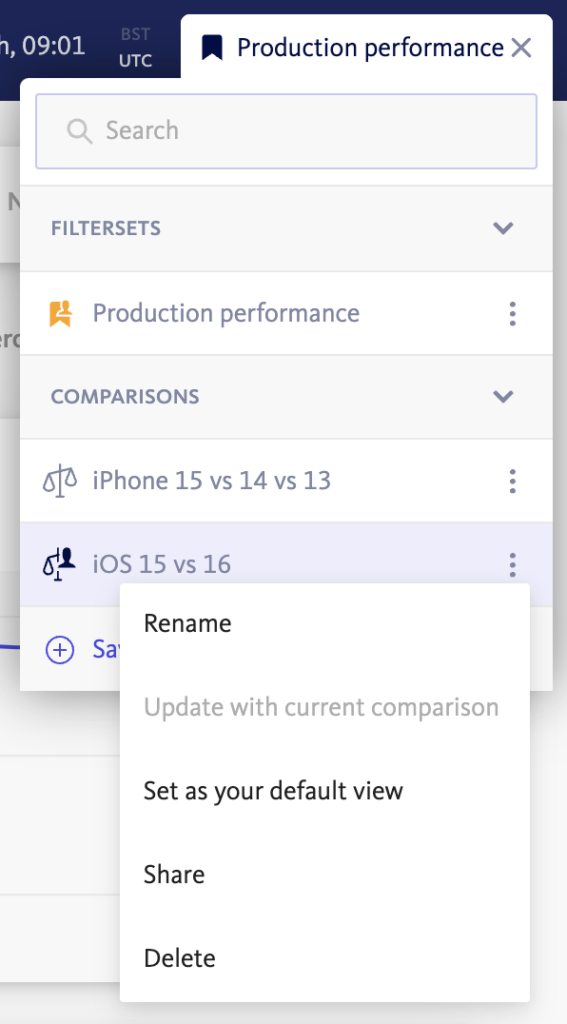
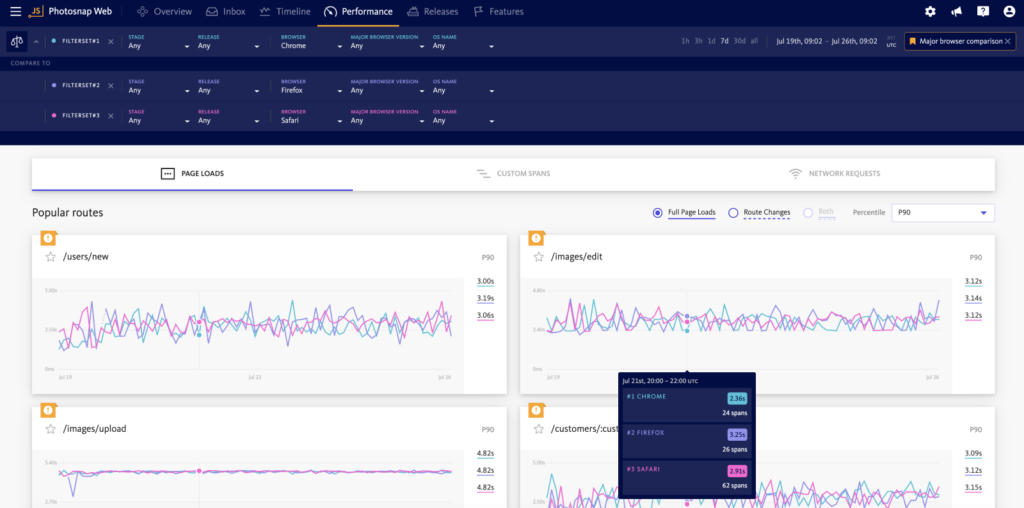
In addition, BugSnag performance comparisons can also be saved to quickly return to the data segments that matter most to you and the BugSnag performance of your application, like a comparison of major web browsers or iPhone models. Selecting a saved comparison will automatically enter comparison mode in the dashboard, with the filtersets in the comparison applied ready for you to explore the data.
What’s Next for BugSnag
Coming soon, navigation will be even more seamless with the introduction of a sidebar in the BugSnag performance dashboard and some other general improvements to the UI. You’ll also be able to set performance targets and get real-time alerts and notifications to let you know when your application’s performance is degraded.
For mobile users, we’ll also be adding the ability to track frame renders via the addition of frame rate metrics to our Performance SDKs. This will help you to keep a responsive UI by detecting and avoiding dropped or frozen frames.
We’re always open to feedback, so let us know if there are other features and functions you’d like to see in BugSnag. Check out the docs to learn more.
If you are looking for a tool that allows you to seamlessly catch, fix, and prevent errors and performance issues, sign up for a free 14-day trial, no credit card required. Want to see more? Sign up for a demo.