BugSnag for server-side
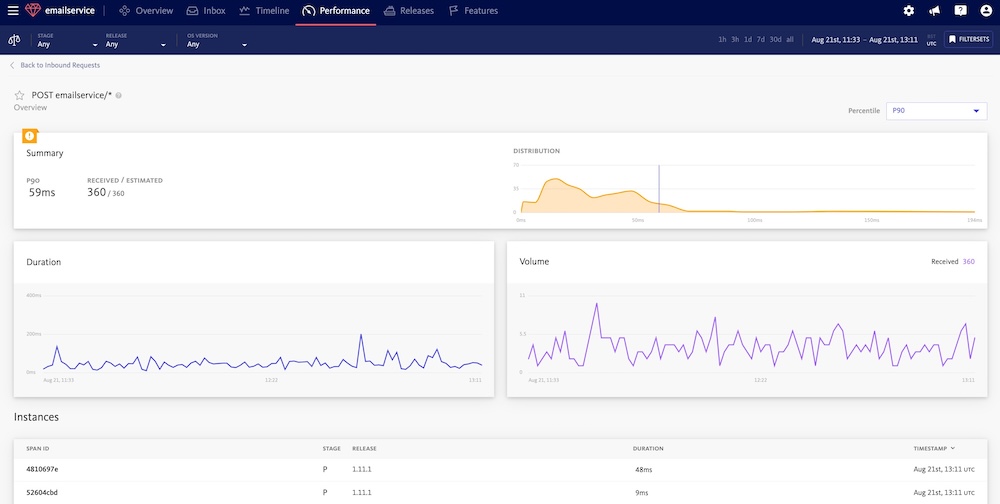
Monitor your back-end performance
BugSnag’s performance monitoring solution now covers server-side platforms. Built as an OpenTelemetry native environment, BugSnag makes it easy to customize your instrumentation so you can efficiently get the back-end insights you need.


Report uncaught and caught exceptions
After completing installation and basic
configuration, uncaught exceptions in your server-side app will be automatically
reported to your BugSnag dashboard along with caught exceptions that you choose to report to
BugSnag.
Easily identify and prioritize the most impactful errors
BugSnag makes it easy to pinpoint the ones with the greatest impact using powerful search and segmentation, coupled with
techniques like correlating errors to user or IP address and versioning your code to track
deployments.


