Measure Your App’s Speed & Success with New Performance Targets
Knowing how well your application is performing is just as important as ensuring it doesn’t crash. But what defines “good performance?” How do you know if your app is hitting the mark or falling behind? With SmartBear BugSnag, you can now use performance targets to set and track specific benchmarks for your application’s performance metrics.
Inspired by BugSnag’s stability score, which helps developers monitor the crash rate of their apps, the new targets are for application performance. Now, you can define what “good performance” means for your app, whether it’s fast screen loads, efficient network requests, or quick app startups.
Why We Created Performance Targets
One of the biggest challenges developers face is understanding what qualifies as good or bad performance for their applications. Many platforms like Android and iOS offer broad performance guidelines, but they often aren’t enough for developers to get a grasp on specific feature performance in their apps. Without specific benchmarks, it can be difficult to gauge whether your app is performing at its best or if it needs improvement.
With performance targets, we aim to solve this problem by providing developers with custom benchmarks to help them quickly assess their application’s performance. These targets are not static – they are designed to evolve as you improve your app, allowing you to continuously raise the bar for what you consider acceptable performance.
How It Works: Setting and Customizing Performance Targets
Setting up performance targets is simple and intuitive with BugSnag. All configuration happens within your project settings. Here’s how you can get started:
- Default Targets for Span Categories: Create a default target for each category of span, such as screen loads or page loads. For example, you might expect all your screen loads to be faster than 500 milliseconds.
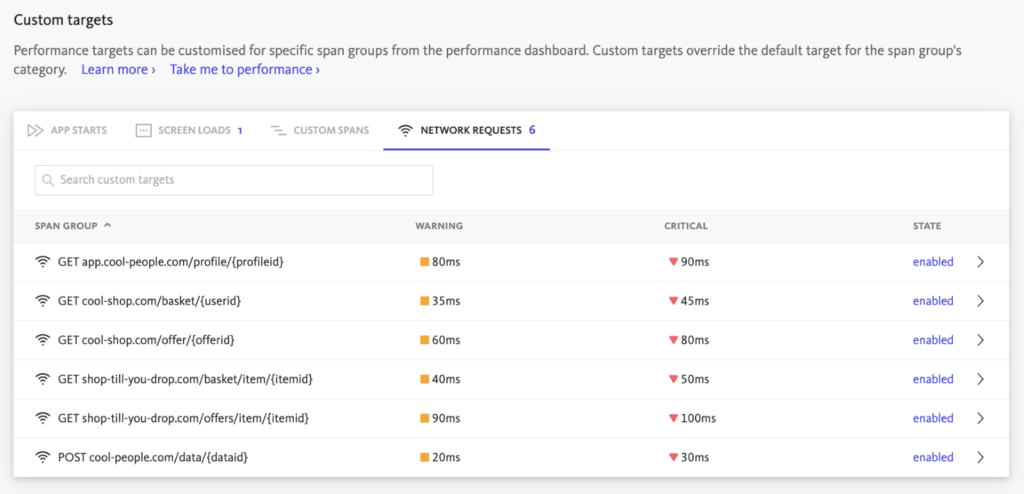
- Custom Targets for Specific Spans: Default targets can provide a general benchmark, . But if a particular screen in your app needs to load faster than others, you can set a stricter target for that screen.
- Suggested Benchmarks: New users of performance targets will see recommended benchmarks for app starts. These suggestions are a starting point that you can then modify based on your needs.
- Opting Out & Customizing Further: If the suggested benchmarks don’t suit your needs, you can opt out and create your own benchmarks, tailored to fit the unique requirements of your app.
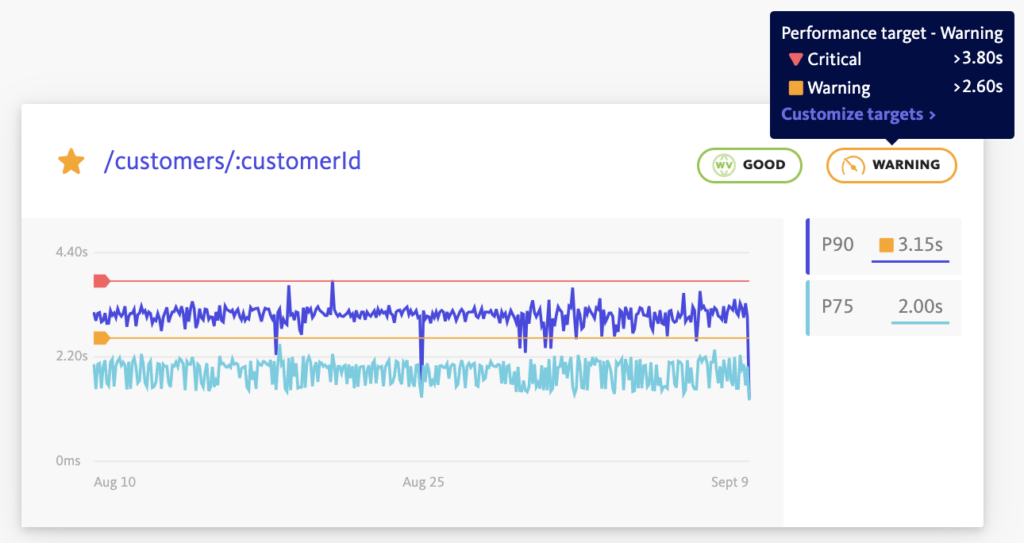
Once you’ve set your targets, the results will be displayed on your dashboards under each span category. Spans will be categorized as Critical, Warning, or Good based on their performance relative to the set targets.
Special Considerations for Web Projects
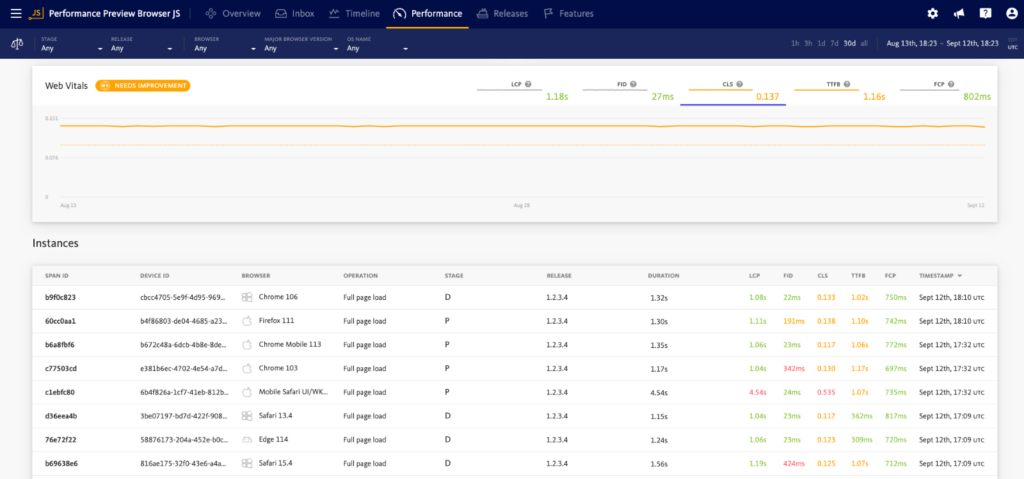
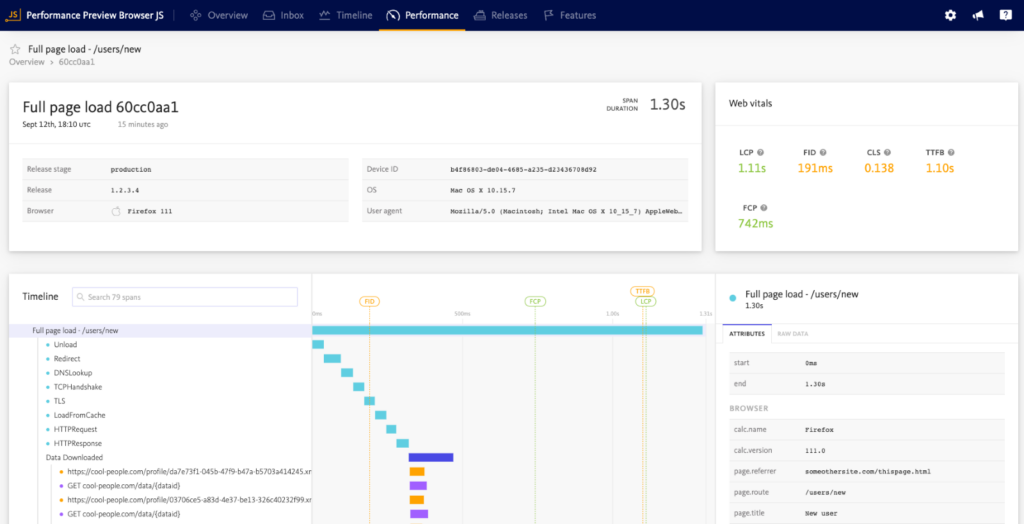
Performance targets are also available on web projects, but with a slight twist. First, there’s an additional banner that prompts you to set targets specifically for page loads. These targets can be configured similarly to app performance targets, but with the added benefit of integrating with web vitals – pre-existing performance metrics based on Google’s benchmarks. Since web vitals are already tiered, there’s no need to create new measurements.
What’s Next for BugSnag?
Coming soon, navigation will be even more seamless with the introduction of a sidebar in the BugSnag performance dashboard and some other general improvements to the UI. You’ll also be able to get real-time alerts and notifications to let you know when your application’s performance is degraded. The customizable alert configuration can cover all your performance targets so you can stay on top of multiple application areas at once.
For mobile users, we’ll also be adding the ability to track frame renders via the addition of frame rate metrics to our Performance SDKs. This will help you to keep a responsive UI by detecting and avoiding dropped or frozen frames.
Check out BugSnag’s new distributed tracing and back-end performance monitoring solutions, so you can get even more granular insights into the root cause of any problems in your application.
We’re always open to feedback, let us know if there are other features and functions you’d like to see in BugSnag. Check out the docs to learn more.
If you are looking for a tool that allows you to seamlessly catch, fix, and prevent errors and performance issues, sign up for a free 14-day trial, no credit card required. Want to see more? Sign up for a demo.