Improve your users’ experiences in real time with React Native error and performance monitoring
Debug native and JavaScript errors in React Native. Get performance monitoring insights for full app visibility.
Deliver higher quality app performance
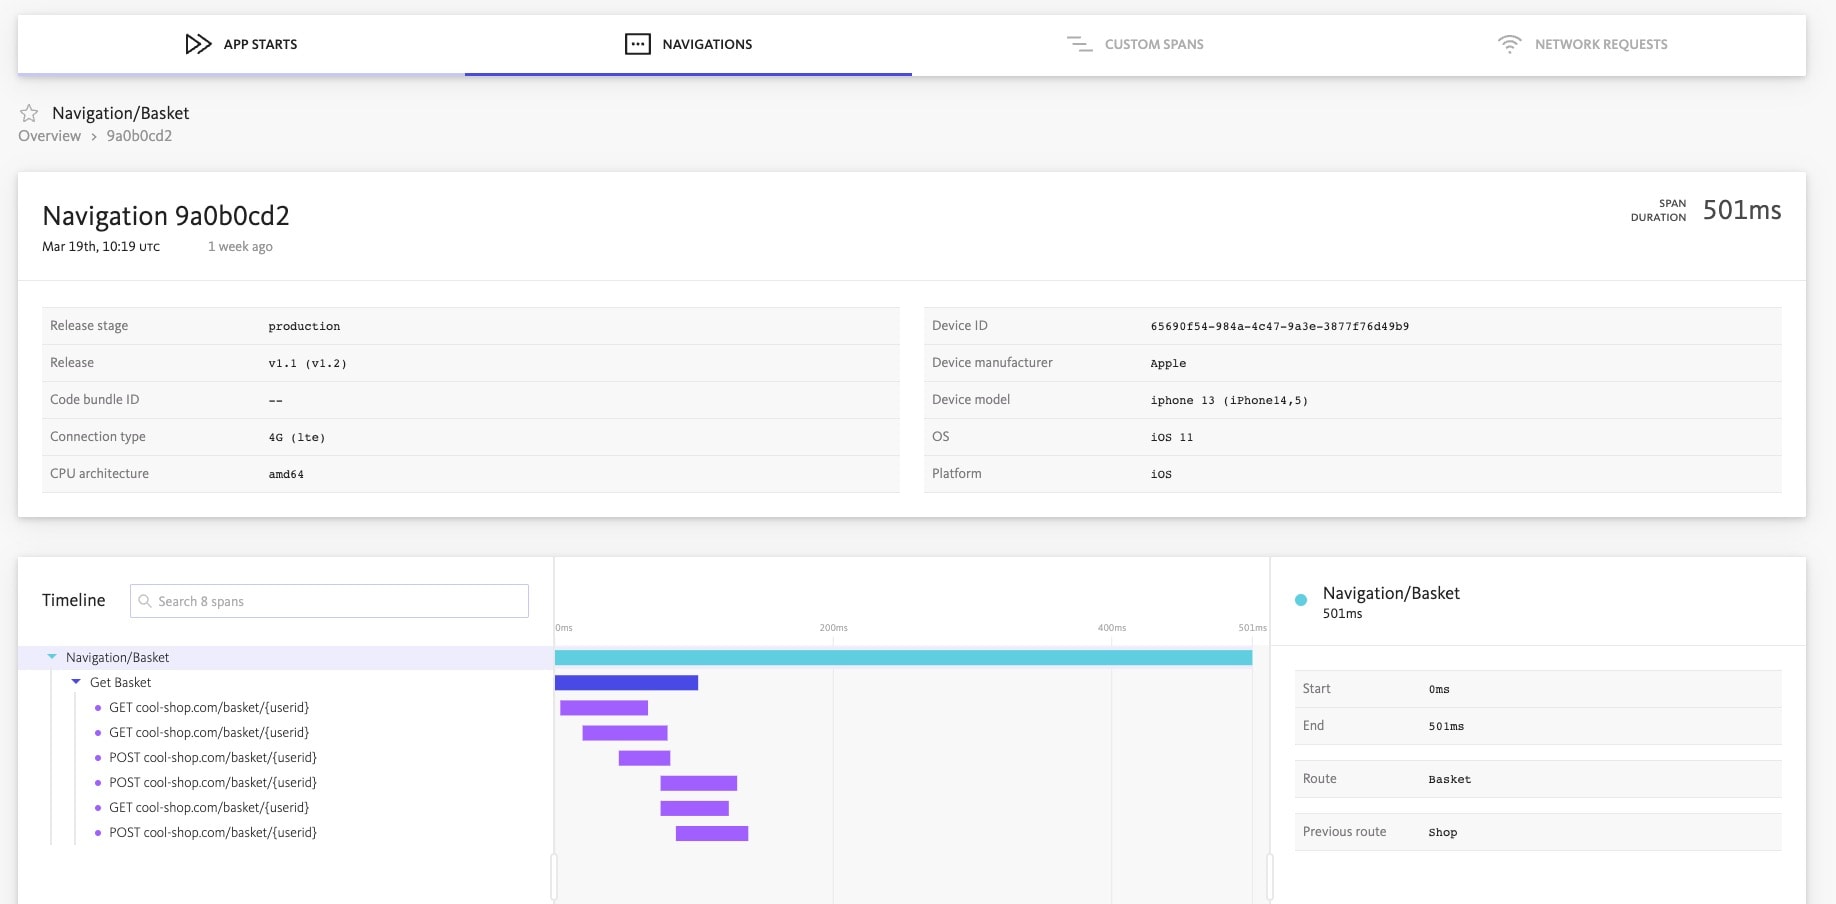
Get the insights you need to identify and fix performance issues with app starts, page loads, network requests, route changes, and more

Real time application performance insights
Real user monitoring insights into web performance to rapidly identify lags and get the context you need to fix the root cause. Leverage user metadata like OS version and device type to pinpoint exactly what went wrong.
24/7 monitoring of your most vital metrics
Monitor screen loads, route changes, network request spans and more to observe trends within your application, and add customer spans so your whole app is covered. Observe key trends and make it easier for your team to spot performance issues.
Pay for insights, not data
Data is worthless without context. Get all of your cost-effective insights built to scale with your business and control data costs with dynamic sampling and OTel compatibility.
Effortless React Native crash reporting
Efficient debugging with BugSnag's React Native library

Seamless integration
Installing Bugsnag for React Native has been optimized to be as easy as possible. Use our CLI to automatically install Bugsnag package dependencies, add your API key to the native configuration files, and update the build process to send source maps to Bugsnag.
Detect native and JS errors with one library
Get full stack traces for all React Native errors in a single project, made possible with support for sourcemaps for JavaScript, dSYMS, and Proguard mapping files for native iOS and Android.
Benchmark releases for better application health
Use the Releases dashboard to decide if a release is successful or needs to be rolled back. The crash rate indicator shows the percentage of sessions in a release that end in a crash, allowing you to compare release health and track improvements over time.
Built for all React Native apps
Bugsnag for React Native works for React Native apps built from scratch, and also existing iOS and Android projects in which you've integrated React Native.

Comprehensive React Native error reports
Automatically captured diagnostic data gives you the answers you need to reproduce and fix React Native errors

Automatically capture detailed error reports
React Native error reporting with Bugsnag provides you comprehensive error reports including diagnostic data like device model, OS version, thread state, and more. You can also see at a glance if the error is impacting users on Android or iOS devices. These details help you investigate and fix errors quickly and effectively.
See user actions leading up to an error
When Bugsnag detects a JavaScript or native error, it automatically captures user actions leading up to the error and displays them in a timeline in your error report, helping you more accurately reproduce crashes.

The hot bug fix toolbox - BugSnag and Code Push
Identify bugs that need fixing with BugSnag and push out instant updates with Code Push

Monitor errors by version or Code Push release
Bugsnag provides complete visibility for errors by app version, or Code Push release. Easily filter for errors introduced in your latest update so that the most relevant errors are surfaced.
Works with obfuscated JavaScript
To get full visibility of an error, Bugsnag uses source maps to de-obfuscate JavaScript stack traces. Source maps can be uploaded in both standard and RAM bundle formats. Bugsnag will link the errors you send with the associated source maps, so it’s easy to see what line of code caused the error.

Developer-first observability insights into React Native apps
Resilient React Native error and performance monitoring that's used on some of the world's biggest sites. We'll be here when you need us most.
Lightweight library
Integrating with Bugsnag's lightweight React Native library does not cause any significant performance decreases.
Open source libraries
Open source libraries allow visibility into error handling code and Bugsnag users can make pull requests to allow for improvements.
Enterprise level security
For total data control and security, Bugsnag can be hosted on-premise. In addition, Bugsnag users can send errors to our servers with 256-bit SSL — equivalent to the level of encryption and security implemented by the world’s leading banks.
What customers are saying
Stacey Snyder
Sr. Director of Engineering, Recurly

Software Engineer, Chime

Nahuel Barrios
Engineering Manager

Antonio Niñirola
Engineering Manager

